Sleep stages on your tracker: how accurate deep, light and REM really are
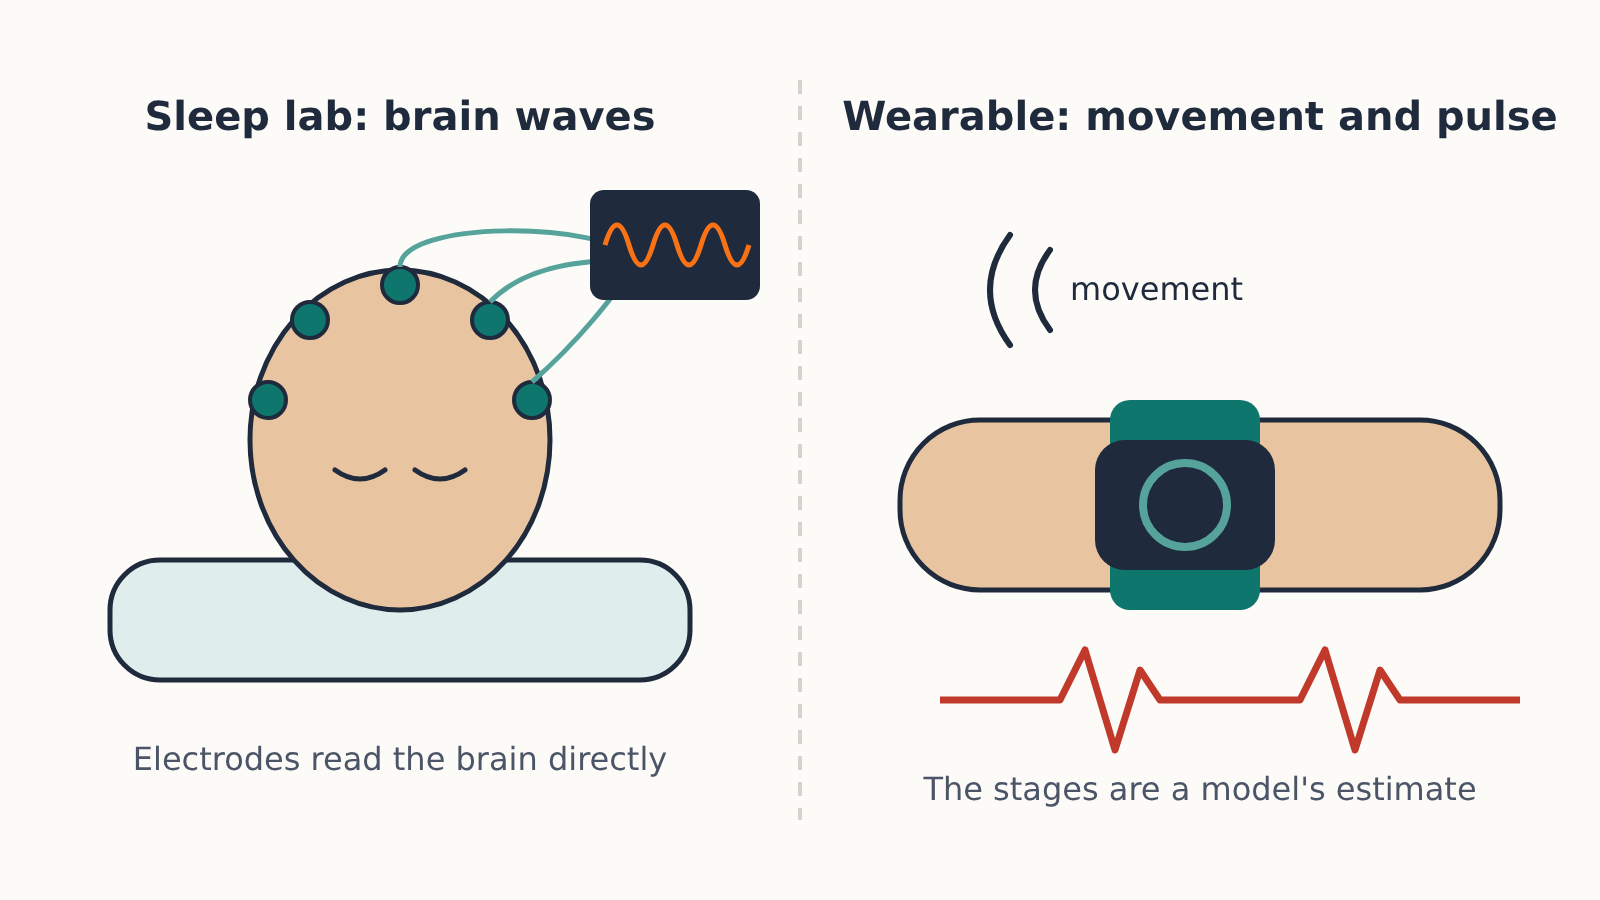
Your watch or ring guesses sleep stages from movement and pulse, not brain waves. It is good at asleep versus awake and weak at one night’s deep and REM split. Here is what the research shows and which numbers to trust.
- Read
- 5 min
- Length
- 1171 words
- Published
- By
- Data2Fit
Your watch or ring cannot see sleep stages. It sees movement and pulse at the wrist or finger, and a model turns those signals into a guess at light, deep and REM sleep. That guess is good at telling asleep from awake, fair at the overall shape of a night, and weak at the minute-by-minute stage split. Trust your total sleep time and your long-run trends far more than last night's deep sleep figure.
How a sleep lab scores stages
The reference every tracker is judged against is polysomnography (PSG), the overnight study done in a sleep lab. Sensors on the scalp record brain waves (EEG), others record eye movements (EOG) and chin muscle tone (EMG), and a trained scorer reads the night in 30-second chunks called epochs. Following the American Academy of Sleep Medicine (AASM) scoring manual, each epoch is labelled wake, N1, N2, N3 or REM.
The stages are defined by what the brain and eyes are doing. N3, the "deep" or slow-wave stage, is literally named for the large, slow brain waves seen on EEG. REM is defined by rapid eye movements, low muscle tone and a particular EEG pattern. Without electrodes on the head, nothing can measure those things directly.
Even the lab isn't perfect. When the AASM ran its inter-scorer reliability program (Rosenberg and Van Hout, Journal of Clinical Sleep Medicine, 2013), trained scorers agreed with the reference scoring on about 83% of epochs overall, with the lowest agreement for N1 and N3. Keep that in mind when a study reports how well a device "matches" PSG: the ceiling is not 100%.
What your wearable measures instead
Consumer sleep trackers work from signals they can pick up at the skin:
- Movement, from an accelerometer. Lying still suggests sleep; shifting suggests wake or light sleep. This is the basis of actigraphy, used in research for decades.
- Heart rate and heart rate variability, from the optical (PPG) sensor. Heart rate tends to fall and become steadier in deep sleep and to rise and become more irregular in REM, so these patterns carry stage information.
- Breathing rate, estimated from the pulse signal on many devices.
- Skin temperature, on some devices such as the Oura ring, along with the time of night, since deep sleep clusters early and REM later.
The maker trains a model on nights where people wore the device and a PSG at the same time, so it learns which combinations of these signals tend to line up with each lab stage. Most apps merge N1 and N2 into "light" sleep and report four categories: awake, light, deep and REM.
This is also why fit matters for sleep as much as for workouts. A loose band gives the model a weaker pulse signal to work from; the same advice in our guide on wearing your tracker for accurate heart rate readings applies at night.
How accurate it is against a sleep lab
The research points the same way across brands.
Asleep versus awake is the strong part. In a 2021 study in Sleep, Chinoy and colleagues compared seven consumer sleep trackers with PSG and found the devices detected sleep well but were less consistent at detecting wake. That is the classic weakness of wrist tracking: if you lie quietly awake, the device sees stillness and a calm pulse and is inclined to call it sleep. The result is that trackers tend to overstate total sleep and understate time awake in the night, more so for people who spend long stretches lying awake.
Stages are harder. For the four-category split, agreement with PSG is noticeably lower than for sleep versus wake. One of the more detailed published validations is Altini and Kinnunen's 2021 study of the Oura ring in Sensors, which reported about 79% epoch-by-epoch agreement with PSG for four stages when movement, heart rate variability, temperature and time-of-night features were combined. That is a reasonable result, but note two things: the authors work for Oura, and 79% agreement still means roughly one 30-second chunk in five is labelled differently from the lab. Apple, Fitbit, Garmin and Whoop describe their own methods and validation on their websites and in papers of varying detail; results from small groups of healthy adults may not hold for older people, shift workers or anyone with a sleep disorder.
In practice, errors are not spread evenly. Light sleep is the biggest category, so it absorbs many of the misclassifications. Deep and REM can be over- or underestimated depending on the device and the person, and the error on any single night can be large.
How to read your sleep stages
Because a single night's stage numbers carry real error, use them the way you would use HRV: against your own baseline, over time.
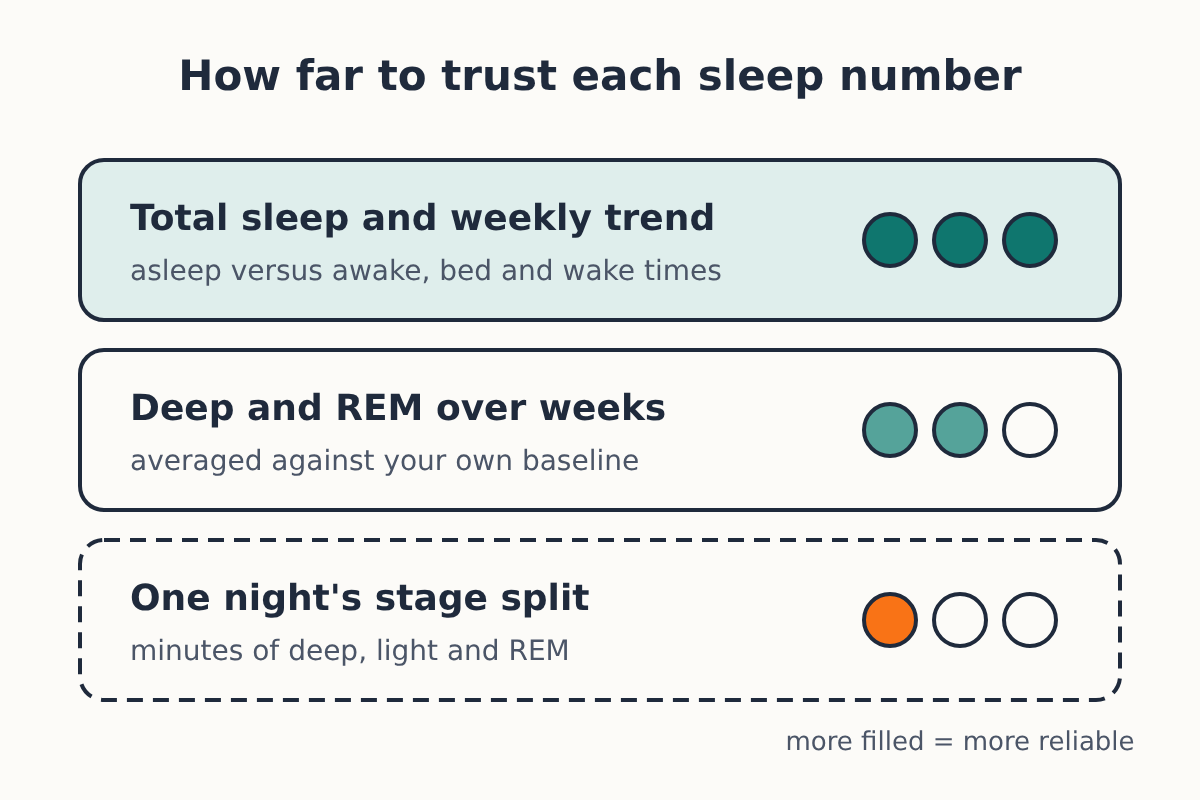
- Lead with total sleep and timing. Sleep duration and the regularity of your bed and wake times are the most reliable things your device reports, and regularity is something you can change.
- Average stages over a week or more. A night with "only 40 minutes of deep sleep" may simply be a misread night. A month where your deep sleep average sits well below your usual is more meaningful.
- Don't compare across brands or with friends. Each maker's model is trained differently, so the same night can produce different stage numbers on two devices.
- Expect age effects. Slow-wave sleep falls with age, a pattern seen across many sleep-lab studies (Ohayon and colleagues pooled them in a 2004 meta-analysis in Sleep). A lower deep sleep figure than a younger friend's is expected, not a problem to fix.
- Look for causes you can see. Alcohol close to bedtime, a late heavy meal, illness and travel across time zones tend to show up first in a higher overnight heart rate and lower heart rate variability, which are measured more directly than stages. If your resting heart rate is up and your sleep score is down on the same nights, the heart data is the firmer evidence.
Don't chase a stage target. Worrying about sleep numbers can itself make sleep worse, and there is no evidence that steering your deep or REM minutes by tracker readings improves health.
When the data says see a doctor
A tracker cannot diagnose a sleep disorder. A few devices now offer sleep apnea or breathing disturbance notifications cleared by regulators, but not getting an alert does not rule anything out. See a doctor if you or a bed partner notice loud snoring with pauses, gasping or choking in the night, if you are very sleepy during the day despite enough time in bed, or if you struggle to fall or stay asleep most nights for weeks. Those call for a proper assessment, which may include a sleep study, and your tracker's history of bed times can be a useful thing to bring along.
