Acute vs chronic training load: what your watch's load ratio really tells you
Your watch compares this week's training with your last four weeks. Here is how that load ratio is calculated, where its famous thresholds came from, why researchers now dispute it, and how to use it sensibly.
- Read
- 5 min
- Published
- By
- Data2Fit
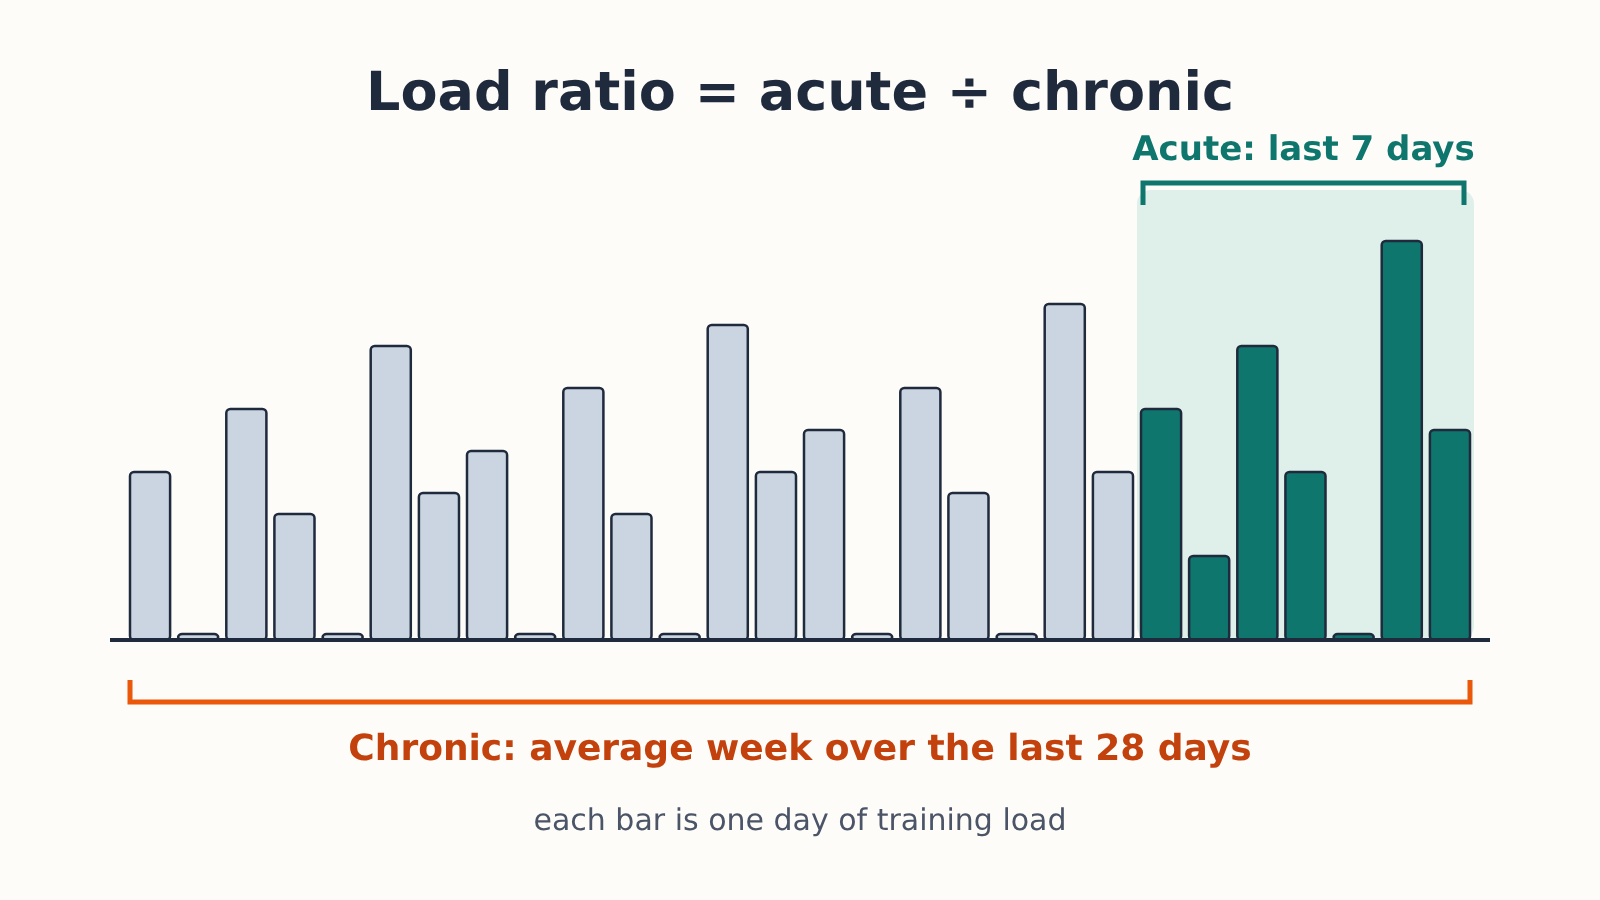
Your watch's load ratio compares how hard you trained in the last seven days with how hard you have trained, on average, over the last four weeks. A ratio near 1 means this week looks like your recent normal. A ratio well above 1 means this week is a jump. That is all it measures, and it is worth knowing both what it is good for and why sports scientists have spent the last few years arguing about it.
What acute and chronic load are
Every workout your watch records gets a load number. On Garmin devices that number comes from Firstbeat's analysis of your heart rate, which estimates EPOC, the extra oxygen your body uses after exercise to recover. Apple Watch, since watchOS 11, builds its Training Load from an effort rating for each workout, which it estimates from heart rate and other workout data and which you can adjust yourself. Other brands use their own heart-rate-based scores. The details differ, but in every case a harder or longer session earns a bigger number.
Acute load is the total for roughly the last week. Chronic load is the average week over a longer window, usually the last 28 days. Divide the first by the second and you get the acute-to-chronic ratio. Garmin shows it as Load Ratio inside Training Status on newer watches, and Apple's Training Load compares your last seven days with your 28-day average and describes the result in words, from well below to well above.
Because the load numbers come from heart rate, they inherit its errors. A wrist sensor that lags during intervals will under-count the hardest sessions; if that matters for you, our guide to when a wrist reading falls behind a chest strap explains when the difference shows up. Zones set from a poor estimate of your maximum heart rate can skew the load too, which is one more reason to set your heart rate zones so they match your body.
Where the idea came from
The ratio became popular through research in team sports. In 2016 Tim Gabbett published "The training-injury prevention paradox" in the British Journal of Sports Medicine, drawing on studies in cricket, rugby league and Australian football. He argued that high training loads were not the problem in themselves; sudden jumps above what an athlete was used to were. In that work, ratios between about 0.8 and 1.3 were described as a "sweet spot" and ratios above about 1.5 as a zone where injury risk climbed.
Those numbers spread quickly into apps and watches. It helps to remember where they came from: professional and semi-professional athletes in a handful of sports, with load measured by GPS or by session ratings of effort, not by a consumer watch.
Why the ratio is now disputed
Several groups have since questioned how much the ratio itself tells you.
The first problem is that the two numbers share data. In the usual calculation this week is part of both the acute and the chronic window. Lolli and colleagues showed in the British Journal of Sports Medicine in 2019 that this mathematical coupling can produce a link with injury even where none exists in the underlying training.
A plain rolling average also hides the order of sessions: it treats a hard session four weeks ago the same as one yesterday. Williams and colleagues proposed exponentially weighted averages in 2017 so that recent days count more, and some devices now weight recent load more heavily.
The deeper objection is to the theory. In papers published in 2020 and 2021, Impellizzeri and colleagues argued that the ratio rests on weak conceptual ground, and that the evidence for using it to predict or prevent injury does not support that use.
The old 10% rule fares no better. A 2008 randomised trial by Buist and colleagues in the American Journal of Sports Medicine put novice runners on a graded programme that followed it and found no fewer injuries than in a standard programme.
None of this means a sudden jump in training is harmless. It means a single ratio from your watch is not a reliable injury forecast, and the cut-offs on the screen are not personal thresholds.
How the same week can look safe or risky
The ratio says nothing about the week on its own. It only says how the week compares with what came before, and that is where most of its surprises come from.
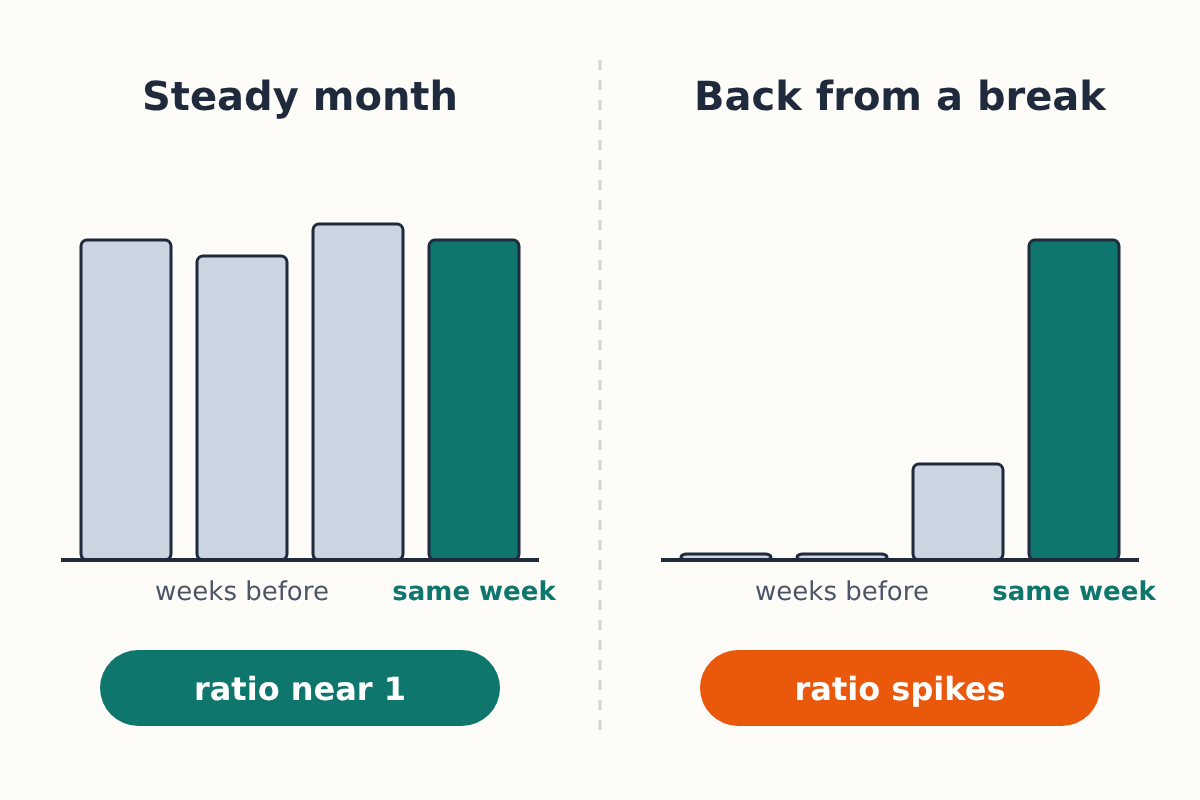
If you have trained steadily for a month, a normal week sits near 1. If you are coming back from illness, travel or a holiday, your chronic load has fallen, so the same week now looks like a big jump. That warning is fair: your body really is less used to the work than it was. But the fix is usually to build back over two or three weeks, not to panic about one high reading.
The reverse happens after a planned easy week. Acute load drops, the ratio falls below 1, and some watches describe that as detraining or as too little load. During a taper before a race, that is exactly what you want.
Using the ratio without being ruled by it
Treat the number as a prompt to look at your week, not a verdict on it.
- When the reading is high, open the week's workouts and see what drove it. One unusually long session, a race or a new kind of training such as hill repeats is a different story from every session creeping up.
- After time off, add a little each week rather than jumping straight back to your old volume. The watch's high-ratio warning after a break is a reasonable reminder of this.
- Pair it with how you recover. Resting heart rate and heart rate variability against your own baseline are separate signals from the load ratio. If load is climbing and your overnight numbers have also moved away from your usual range for several days, that is a stronger reason to take an easy day than either signal alone.
- The watch cannot see everything. Work stress, poor sleep, a heavy gardening weekend or strength sessions you did not record all count for your body but not for the ratio.
- Pain that changes how you move, or that gets worse as you run, is a reason to stop and, if it persists, to see a doctor or physiotherapist, whatever the ratio says.
